LaTeX templates and examples — Essay
Seneste
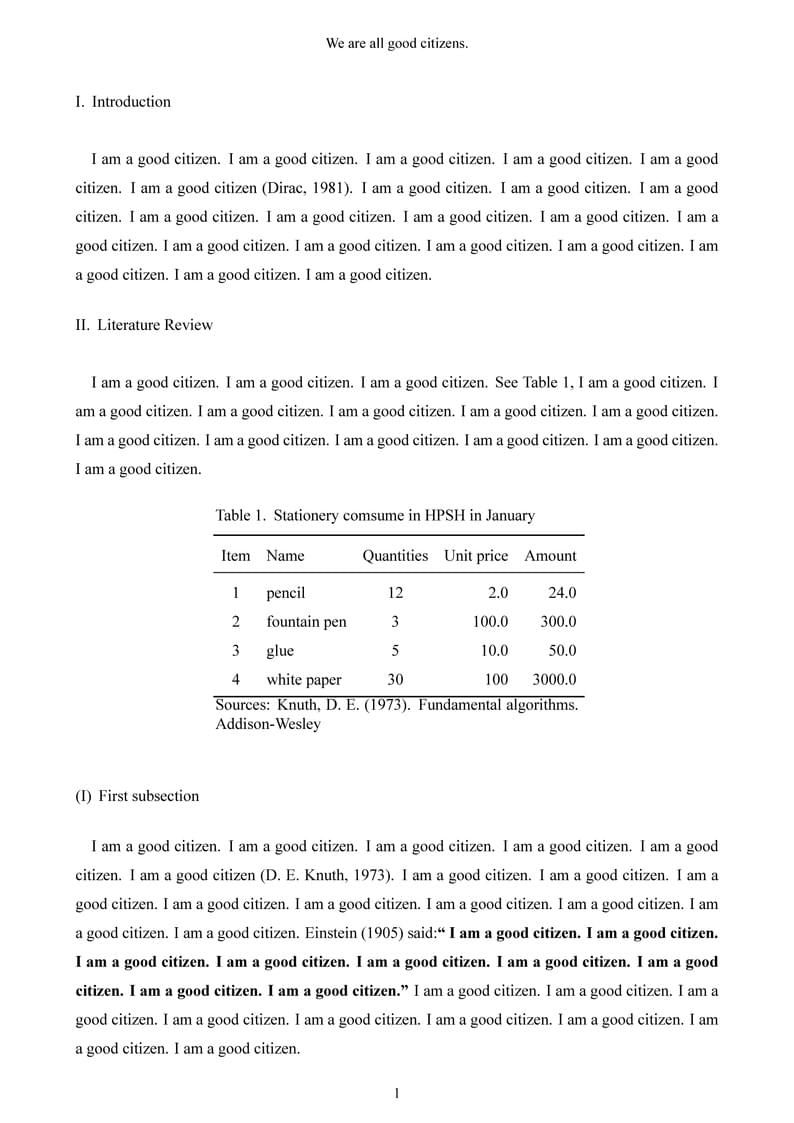
High School Students Simple Essay Contest in Taiwan By Taipei Municipal Heping High School
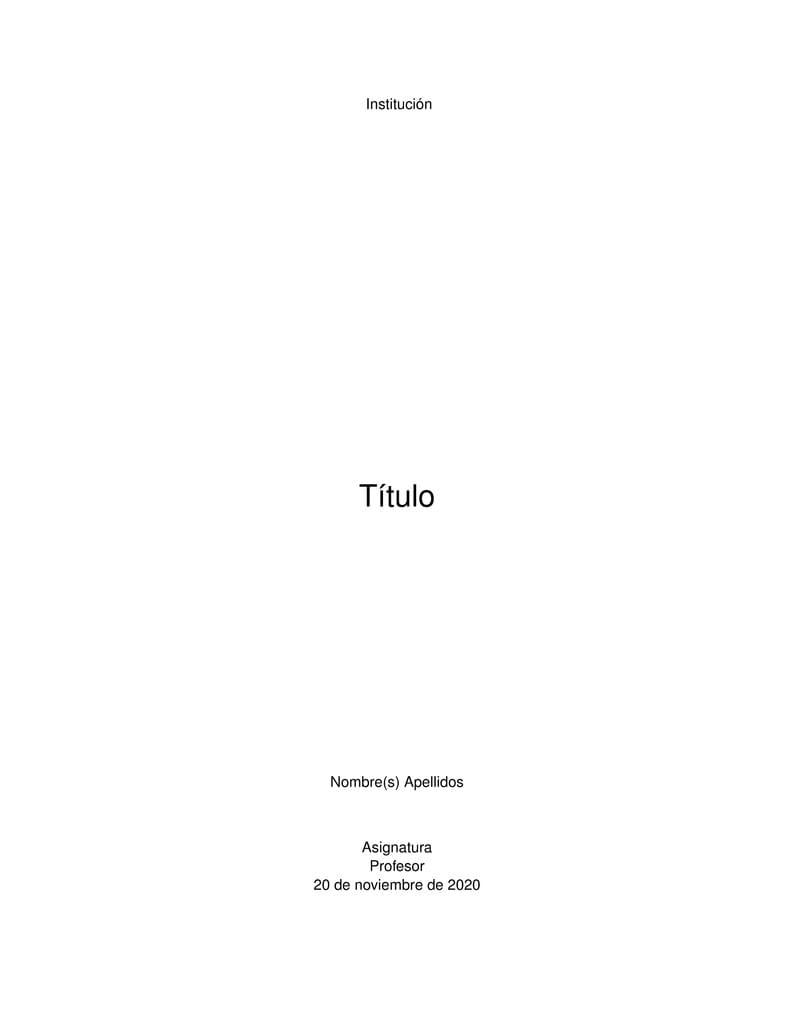
Plantilla en formato MLA con contenido conforme a la estructura IMRaD.
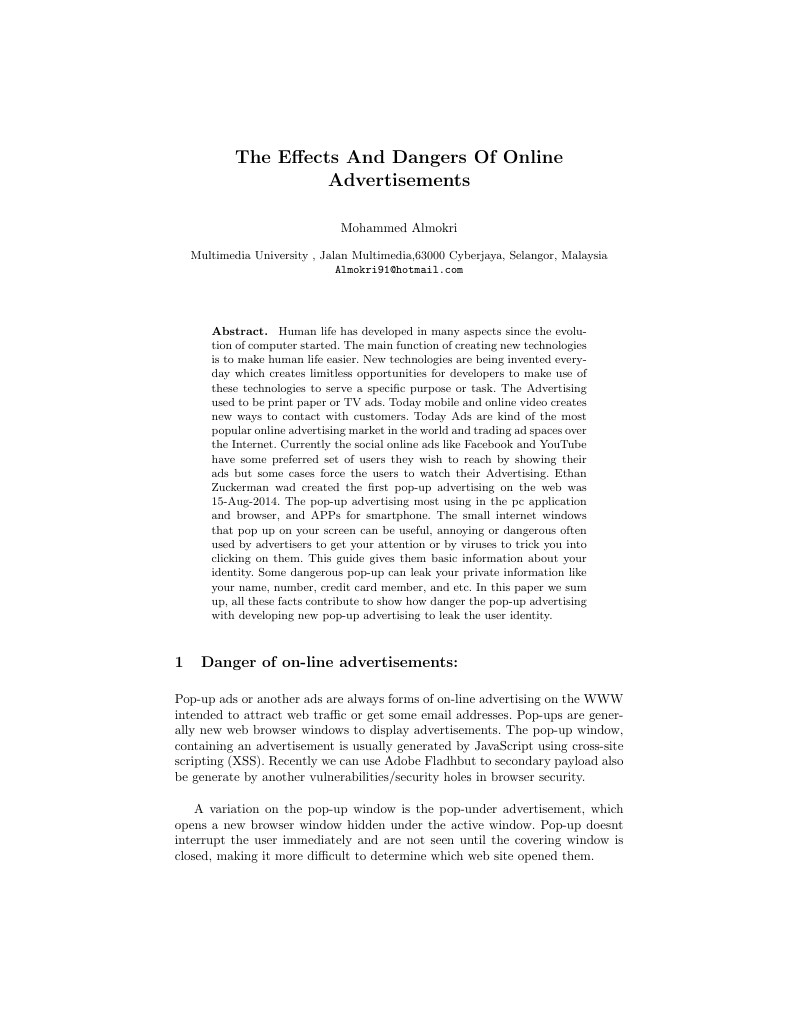
Human life has developed in many aspects since the evolution of computer started. The main function of creating new technologies is to make human life easier. New technologies are being invented everyday which creates limitless opportunities for developers to make use of these technologies to serve a specific purpose or task. The Advertising used to be print paper or TV ads. Today mobile and online video creates new ways to contact with customers. Today Ads are kind of the most popular online advertising market in the world and trading ad spaces over the Internet. Currently the social online ads like Facebook and YouTube have some preferred set of users they wish to reach by showing their ads but some cases force the users to watch their Advertising. Ethan Zuckerman wad created the first pop-up advertising on the web was 15-Aug-2014. The pop-up advertising most using in the pc application and browser, and APPs for smartphone. The small internet windows that pop up on your screen can be useful, annoying or dangerous often used by advertisers to get your attention or by viruses to trick you into clicking on them. This guide gives them basic information about your identity. Some dangerous pop-up can leak your private information like your name, number, credit card member, and etc. In this paper we sum up, all these facts contribute to show how danger the pop-up advertising with developing new pop-up advertising to leak the user identity.
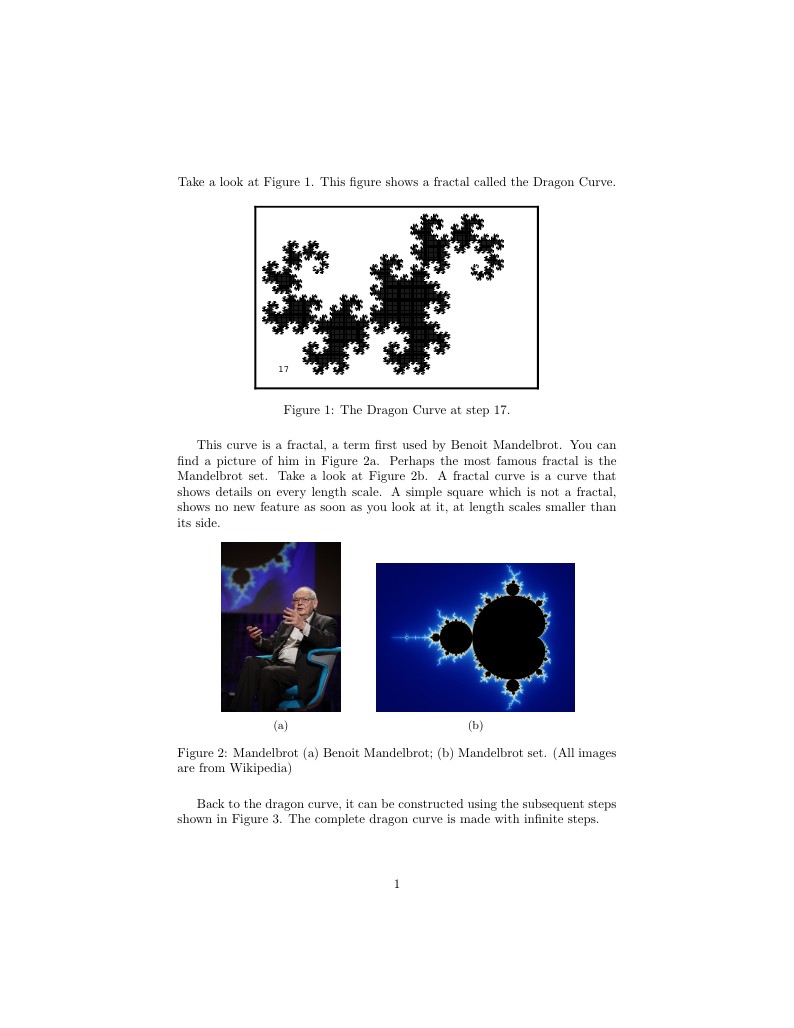
This was an assignment for a college physics course. Please let me know what you think! :)
Template for Radboud University essays and short papers. (Not meant to be a thesis template!)
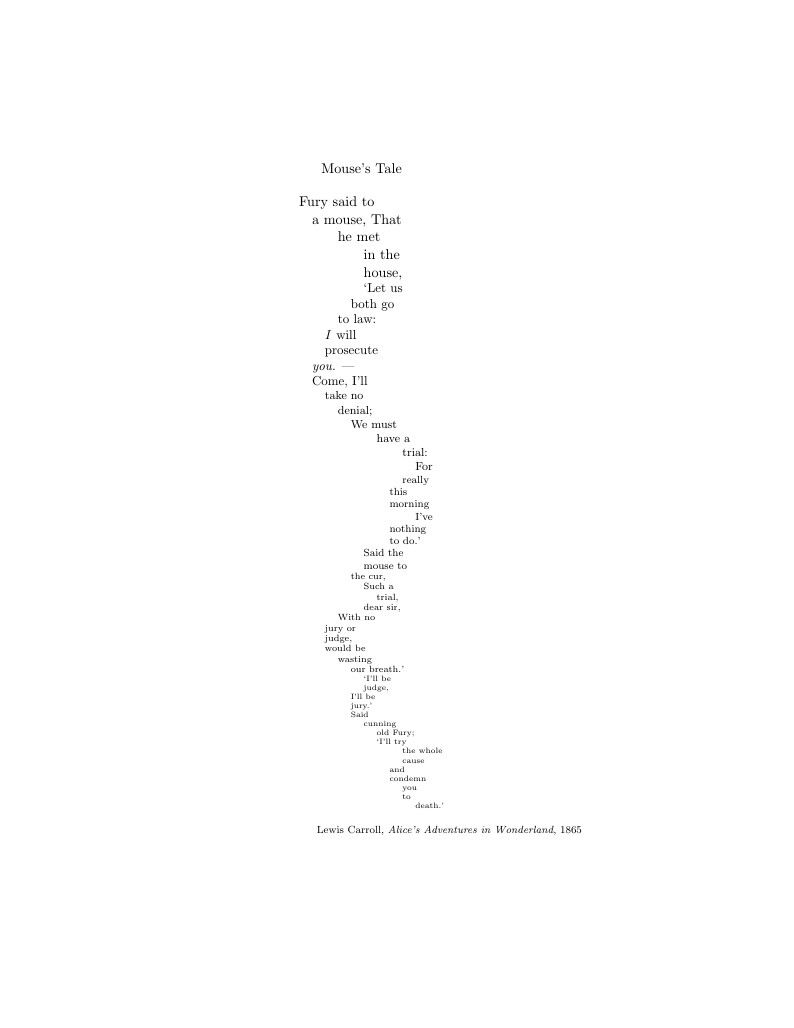
This example from section three of the LaTeX verse package documentation demonstrates an ambitious use of \indentpattern to create a striking visual effect. In this case it is defined to recreate the famous typesetting of the original Mouse's Tale as it appeared in print. Background: "The Mouse's Tale" is a poem by Lewis Carroll involving a 'quadruple pun' which appears in his novel Alice's Adventures in Wonderland. It uses typesetting style to create the final pun (it is a mouse's tale typeset in the shape of a mouse's tail). For more details see the poem's Wikipedia entry.
Template for essay along with cover page
A simple, minimalist statement template for any use, but designed with academic teaching and research statements in mind. Features a running head & custom low vision accessible font.
Buffer overflow attacks, Integer overflow attacks and other forms of attack.
\begin
Discover why over 25 million people worldwide trust Overleaf with their work.