LaTeX templates and examples — Dynamic Figures
Seneste
The objective is to study the effect of different experimental parameters on the reconstruction of the density of states (DoS) and to verify the viability of the 1D/2D simulation model developed at GeePs. Beside the calculation of the DoS through the modulated photo-current method (MPC), the ambipolar minority carrier diffusion length is measured through steady state photocarrier grating (SSPG) and the majority carrier lifetime / mobility product is measured through steady state photo-conductivity (SSPC). The measurements were observed to be in agreement with the theoretical simulations, but further experiments are needed to accurately conclude the need of a 2D simulation for the MPC experiment.
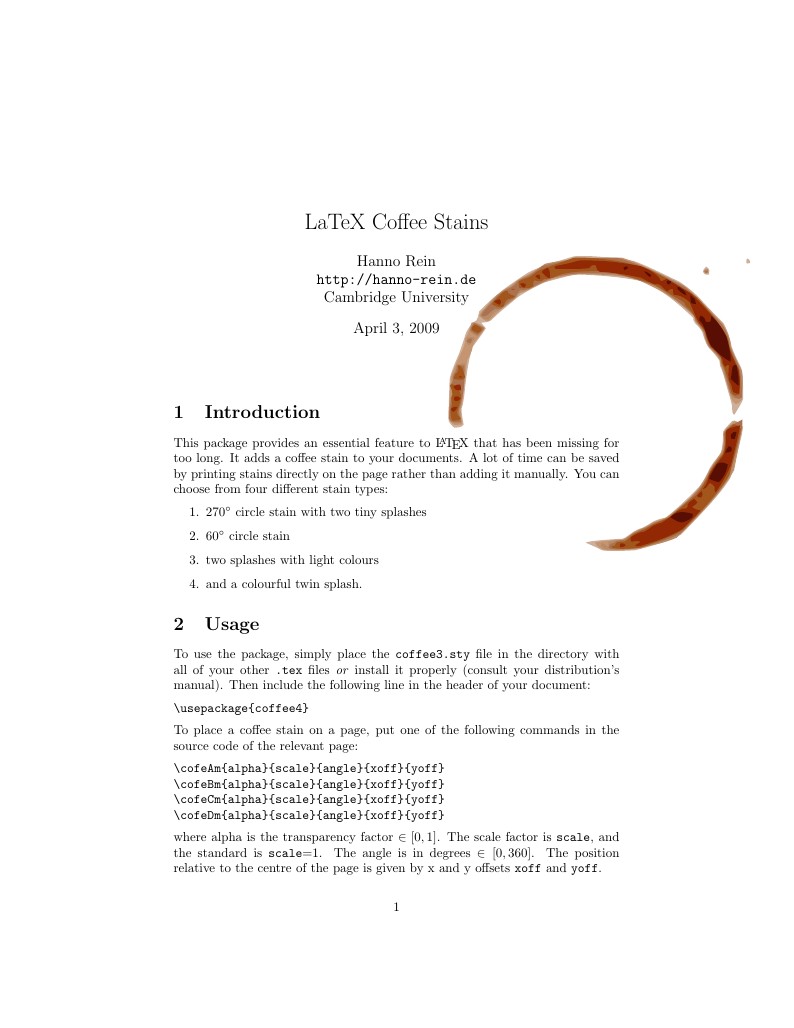
This package provides an essential feature to LaTeX that has been missing for too long. It adds a coffee stain to your documents. A lot of time can be saved by printing stains directly on the page rather than adding it manually. You can choose from four different stain types.
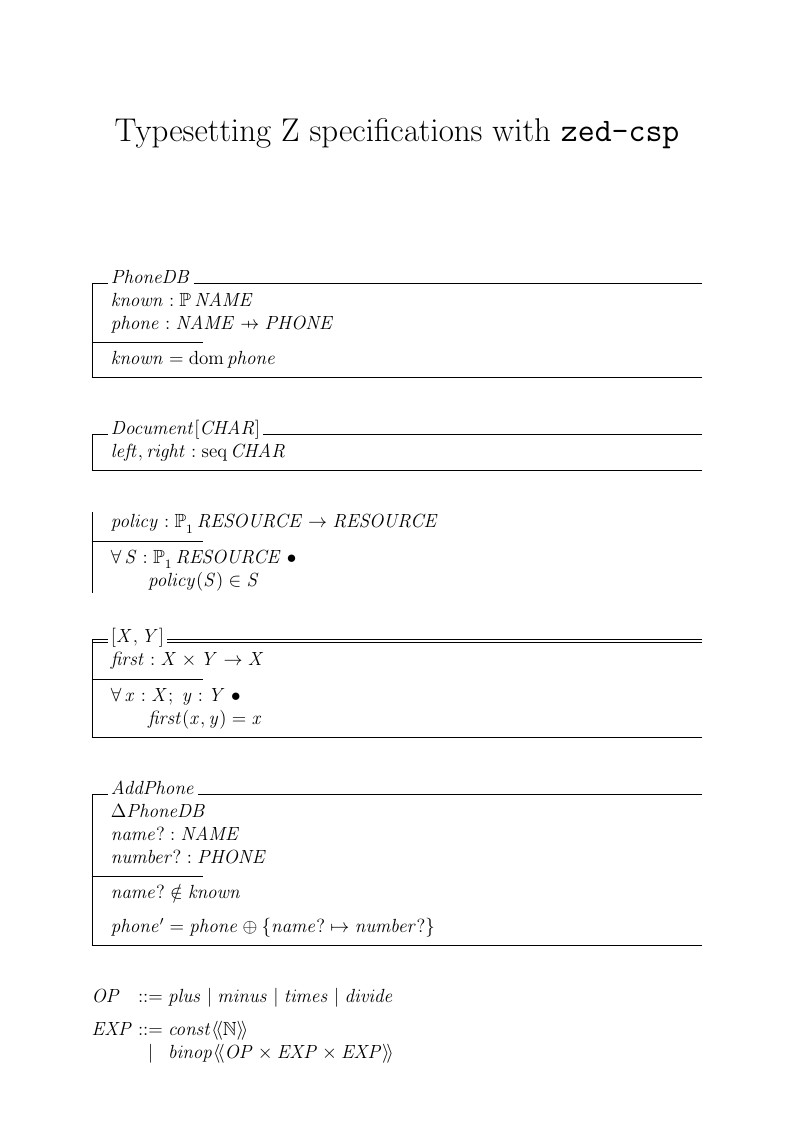
Examples from the zed-csp documentation.
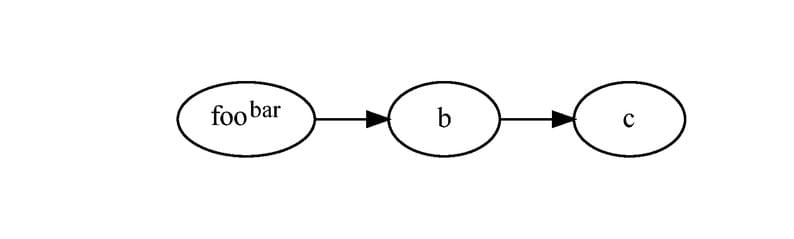
An example of the graphviz package, which uses dot in the background to draw graphs. Add \usepackage[pdf]{graphicx} to get HTML-like labels working.
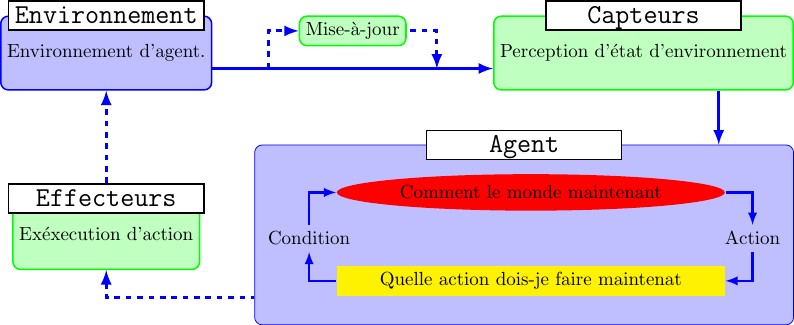
In artificial intelligence, an intelligent agent (IA) is an autonomous entity which observes through sensors and acts. This diagrams can be used to represent the different modules that show how the simple agent work.
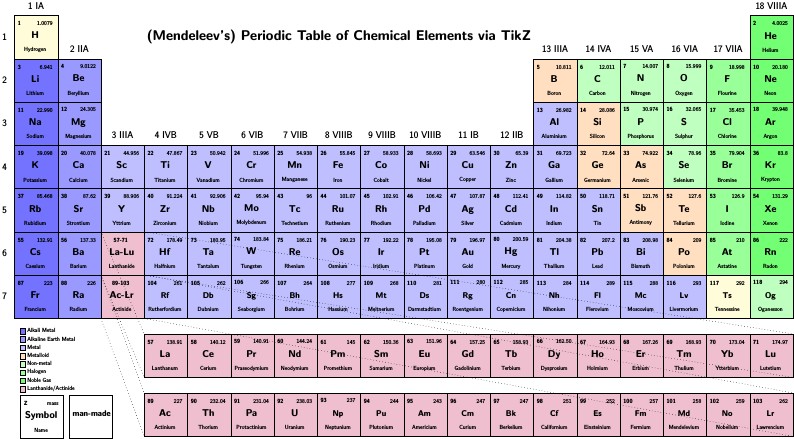
Copyright 2009 Ivan Griffin This work may be distributed and/or modified under the conditions of the LaTeX Project Public License, either version 1.3 of this license or (at your option) any later version. The latest version of this license is in http://www.latex-project.org/lppl.txt and version 1.3 or later is part of all distributions of LaTeX version 2005/12/01 or later. This work has the LPPL maintenance status `maintained'. The Current Maintainer of this work is Ivan Griffin This work consists of the files periodic_table.tex
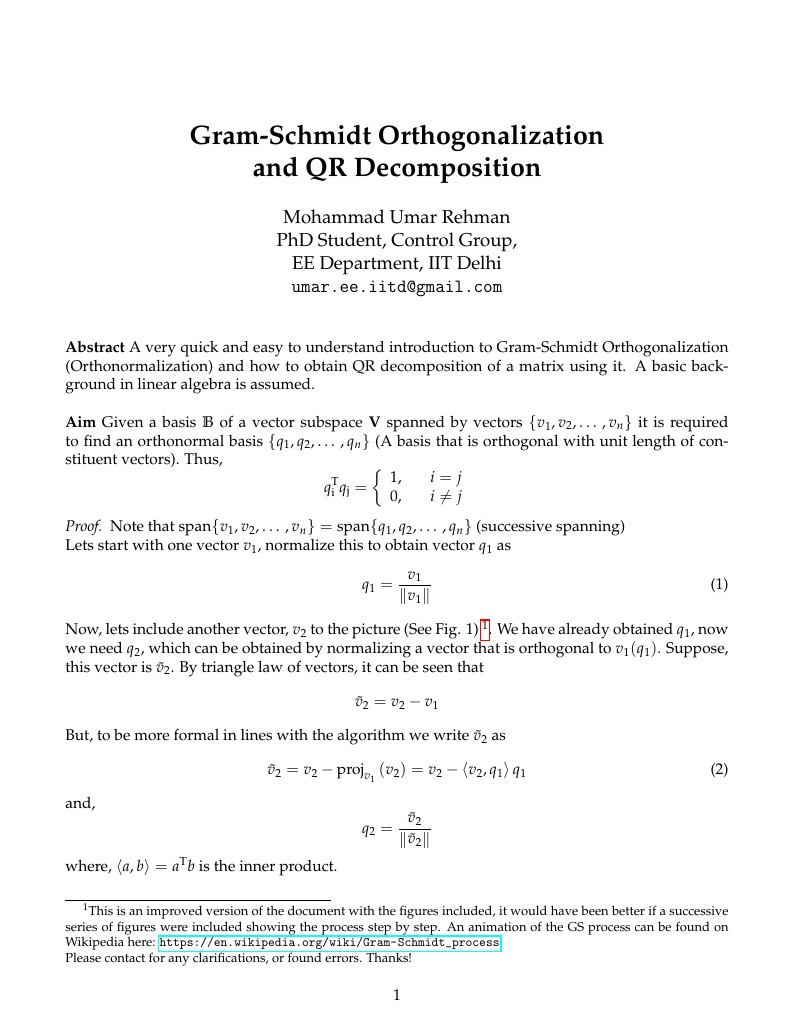
A very quick and easy to understand introduction to Gram-Schmidt Orthogonalization (Orthonormalization) and how to obtain QR decomposition of a matrix using it.
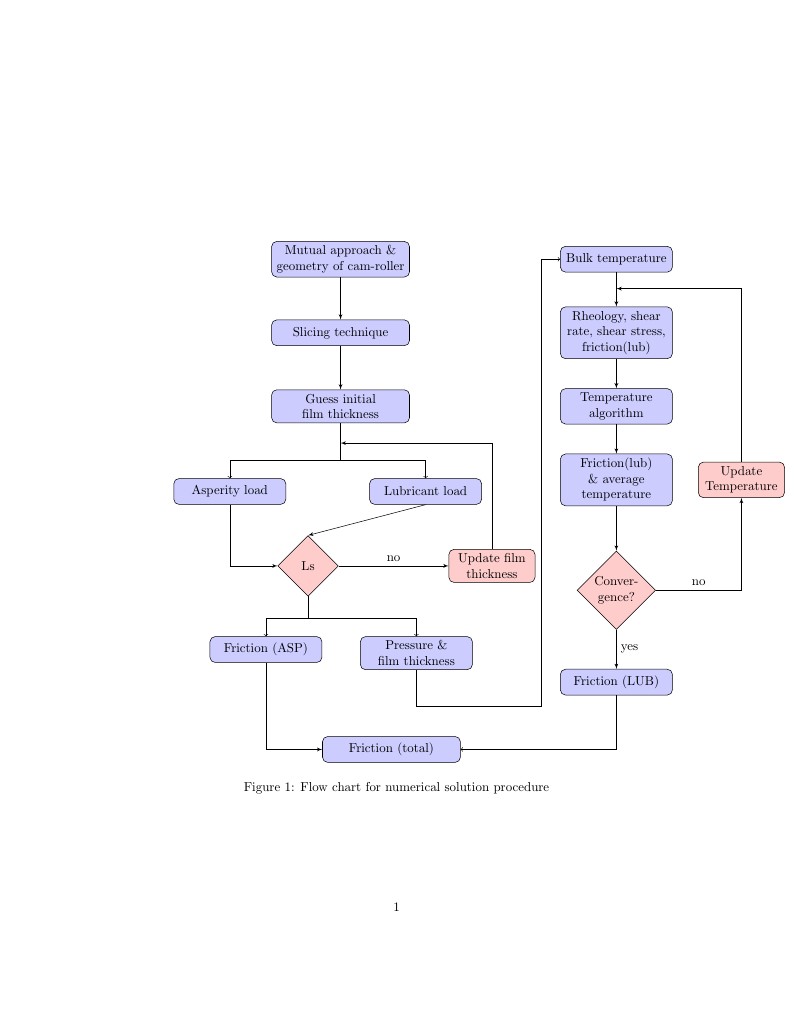
A little bit more advanced flowchart than the simple flowchart example at: http://www.texample.net/tikz/examples/simple-flow-chart/

Esta es una imagen de la Bandera del Reino Unido de Gran Bretaña e Irlanda del Norte, también llamada "Union Jack" cuya versión final apareció en 1802, al producirse la unión de Gran Bretaña con Irlanda, a raíz de lo cual se incluyó la cruz de San Patricio porque con anterioridad ya se habían combinado las cruces de los patronos de Inglaterra y Escocia. La cruz permanece en la bandera aunque en la actualidad solamente Irlanda del Norte forma parte del Reino Unido. La "hoja de construcción" de la bandera se ha tomado de la página web http://vexilla-mundi.com/united_kingdom_flag.html, y las tonalidades de colores azul y rojo provienen de http://i1.wp.com/www.flaginstitute.org/wp/wp-content/uploads/2013/05/3x5-union-diagram.png?w=587, aunque no parece haber tonalidades que se consideren estándar. Los nombres de los colores son tomados de la página http://htmlcsscolor.com/.
\begin
Discover why over 25 million people worldwide trust Overleaf with their work.