LaTeX templates and examples — Charts
LaTeX can be used to produce a variety of different charts and diagrams, including: flowcharts, gantt charts, pie charts, branching and decision trees, family trees, histograms, bar charts and more. If you're looking for a particular type of chart that isn't featured here, please let us know, or submit your own example to the gallery.
Seneste
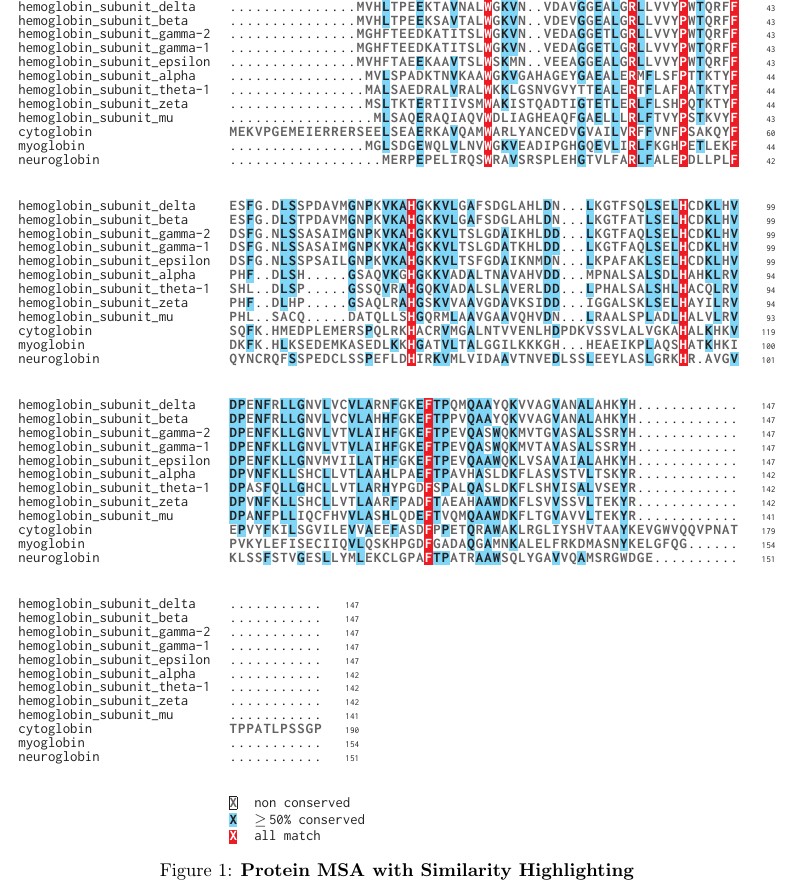
This template is used to create standalone, publication-quality figures for multiple sequence alignments using the texshade package.
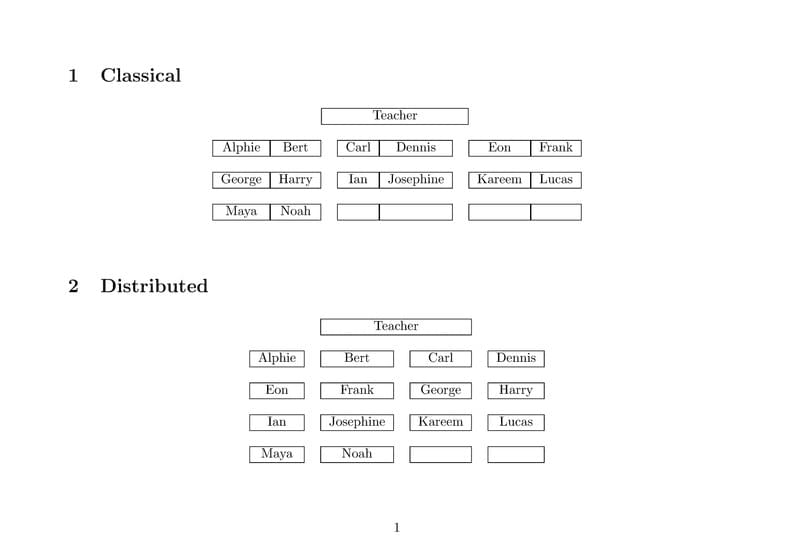
A student seating chart can be used by a teacher when indicating where students should sit in the classroom. This template has 5 suggestions: "classical", "distributed", 'lab", "U-shape" and "square". The examples show 14 students, but rows can be added manually.
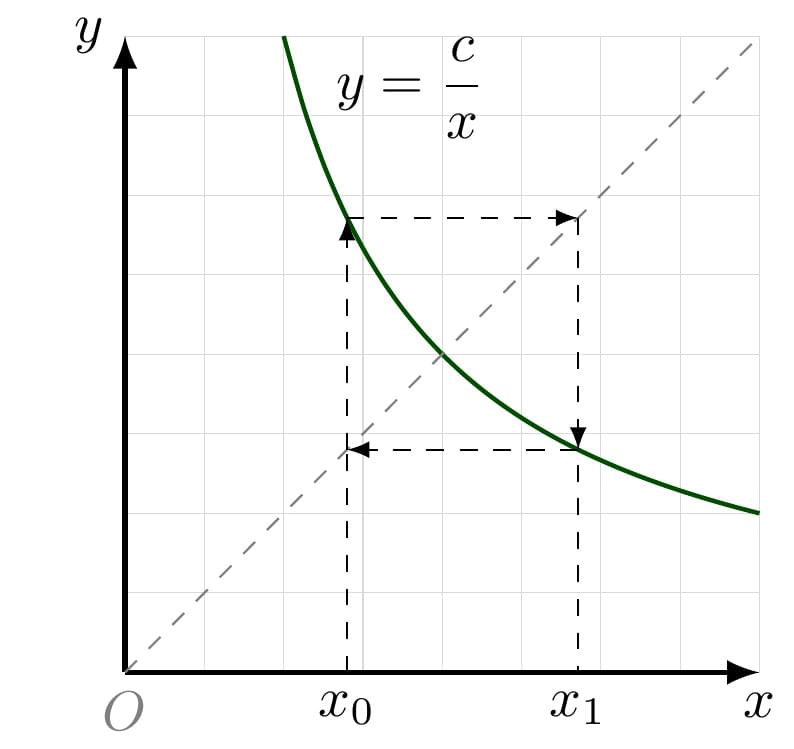
\(y=\frac{c}{x}\)
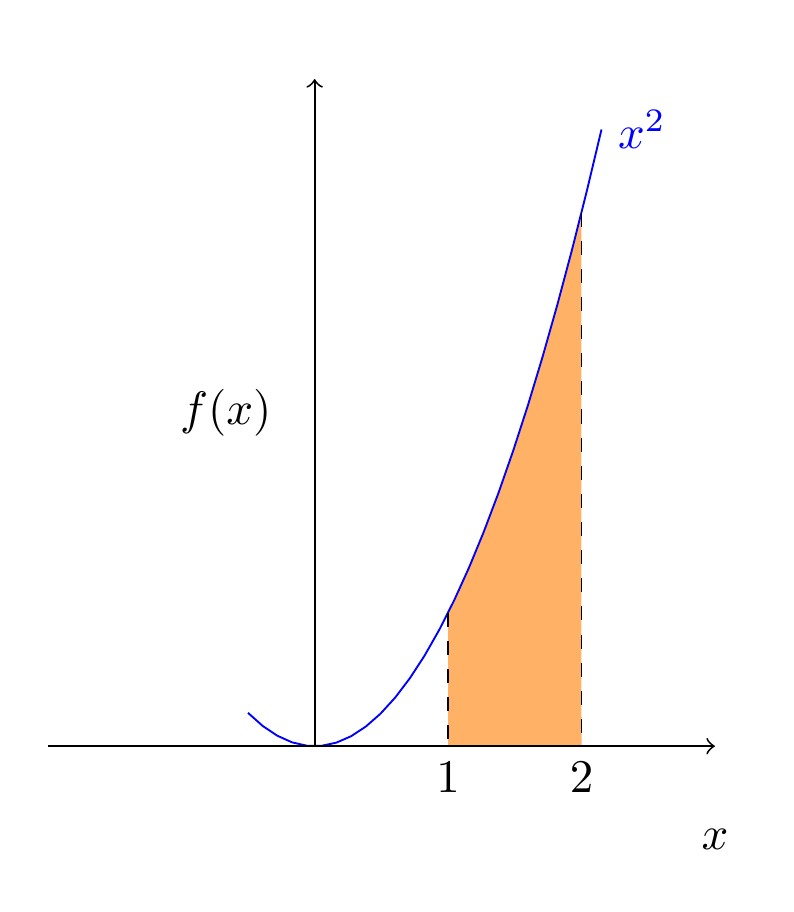
Neste projeto é apresentado o código para criar uma região colorida sob um gráfico. Para detalhes sobre o projeto: marcos.ufal.mat@gmail.com
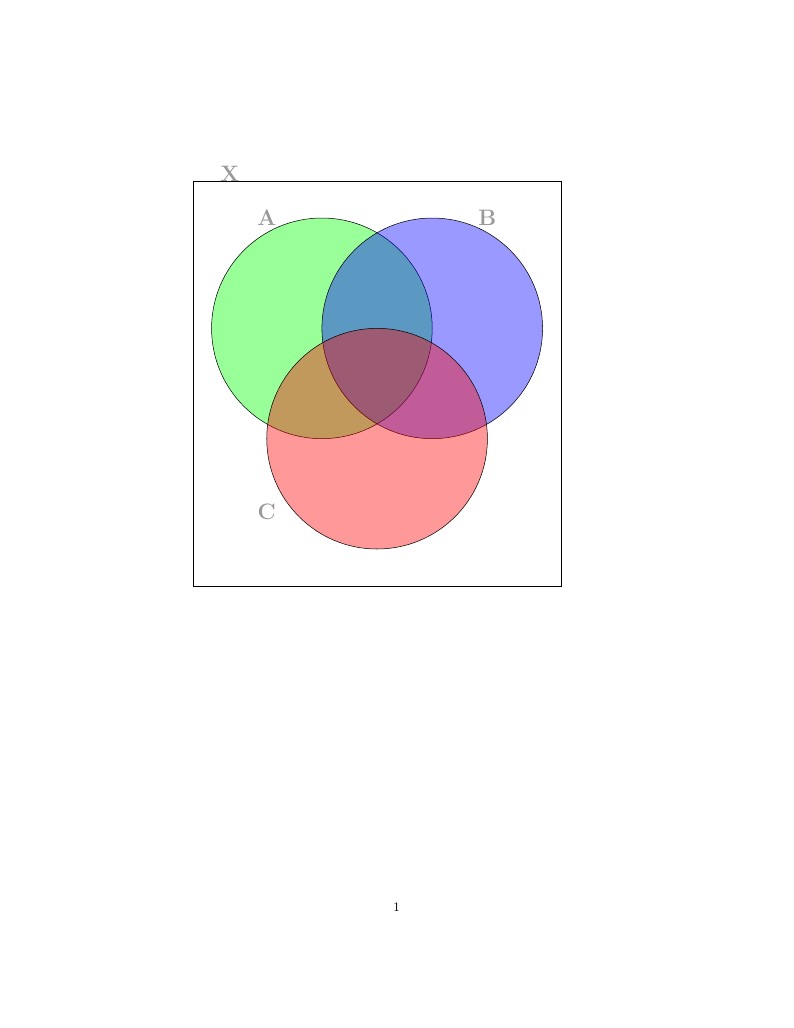
This is a short template on the creation of Venn Diagrams.
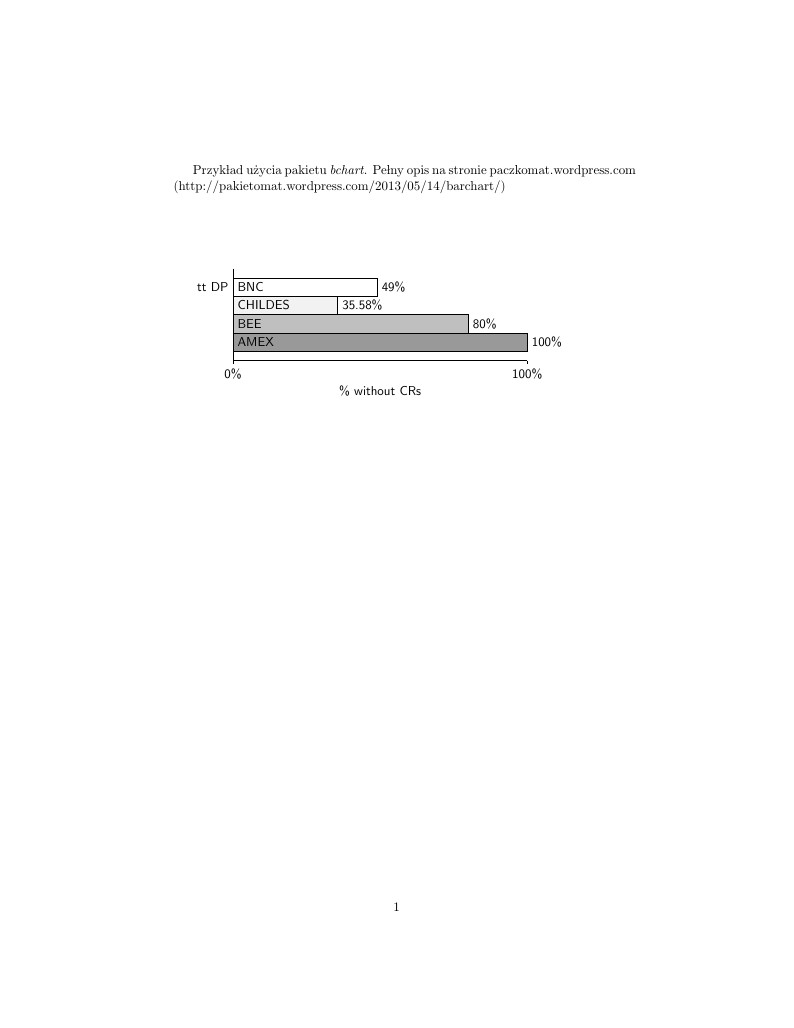
Bchart jest doskonałym pakietem, jeżeli chcesz szybko i wygodnie przygotować wykres słupkowy w LaTeX-u. Czytaj więcej na: http://pakietomat.wordpress.com/2013/05/14/barchart/
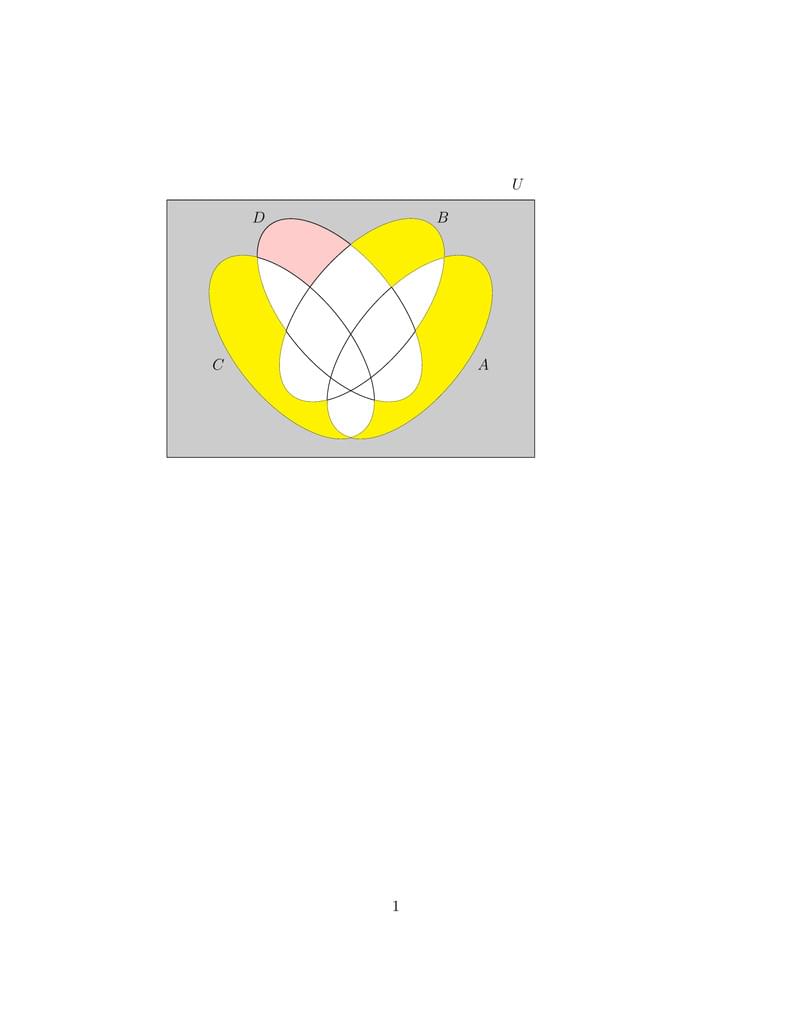
This example helps to show how the isolated areas of a Venn diagram can be filled / coloured. It was created as part of this answer on TeX StackExchange. Other options for creating Venn diagrams with multiple areas shaded can be found in the Overleaf gallery via the Venn Diagrams tag.
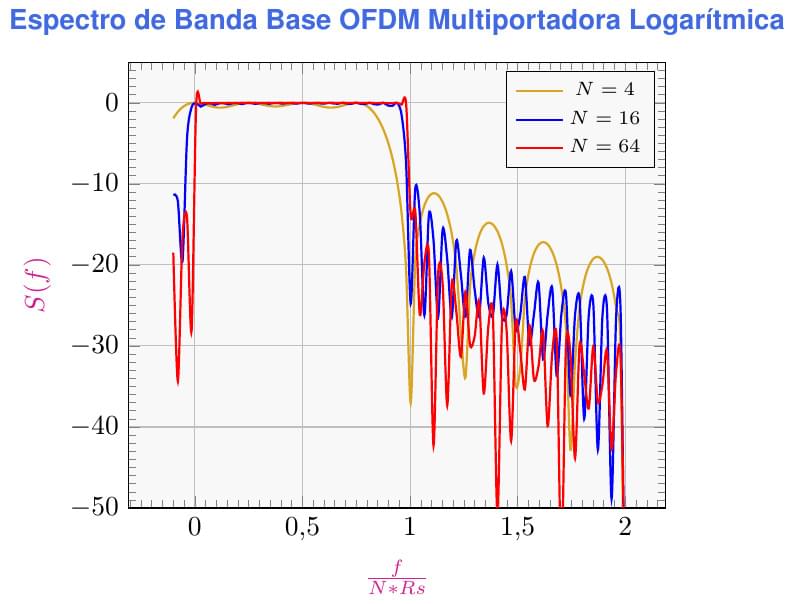
Este listado LaTeX es una versión logarítmica del proyecto "Espectro de Banda Base OFDM Multiportadora" que muestra las notorias diferencias en el trazado de las curvas del espectro OFDM correspondiente a 4, 16 y 64 subportadoras, cuando se aplica una escala lineal logarítmica en base 10. Esta figura se basa en la mostrada en la página 643 del texto "Digital Modulation Techniques, Second Edition", de Fuqin Xiong, de la editorial Artech House, Inc.
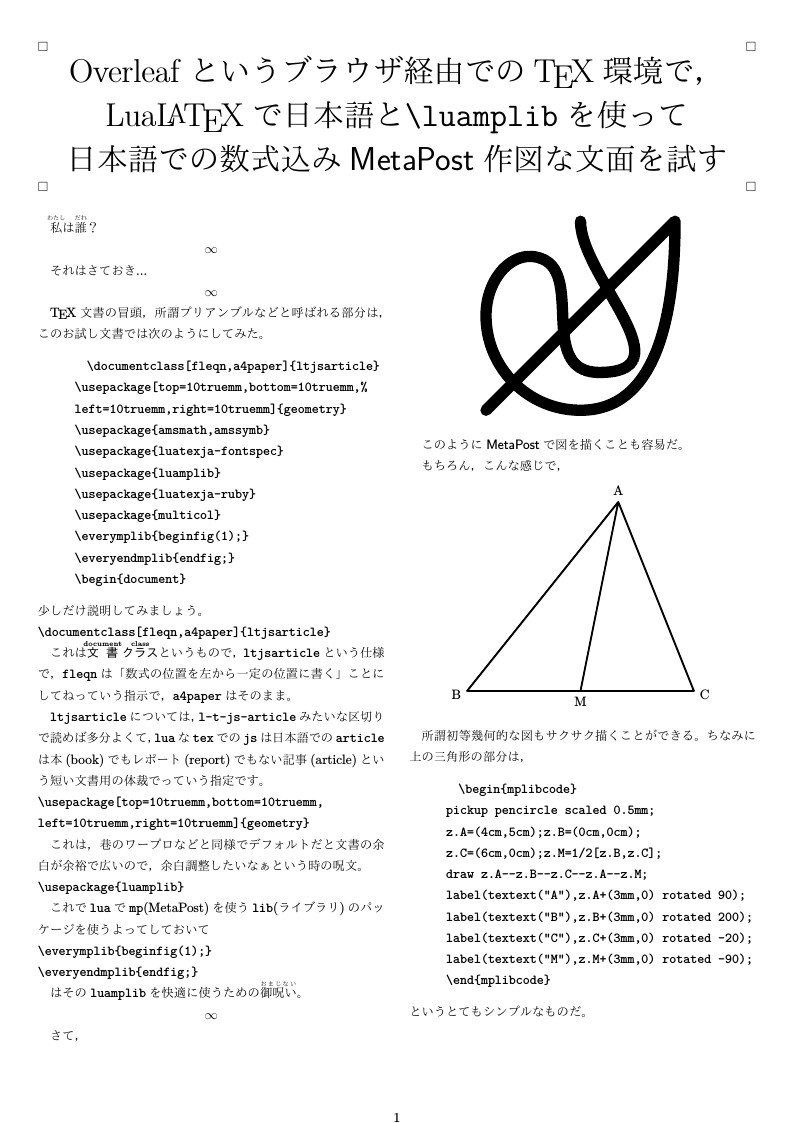
Test paper for Japanese TeX and MetaPost User
\begin
Discover why over 25 million people worldwide trust Overleaf with their work.