LaTeX templates and examples — Charts
LaTeX can be used to produce a variety of different charts and diagrams, including: flowcharts, gantt charts, pie charts, branching and decision trees, family trees, histograms, bar charts and more. If you're looking for a particular type of chart that isn't featured here, please let us know, or submit your own example to the gallery.
Seneste
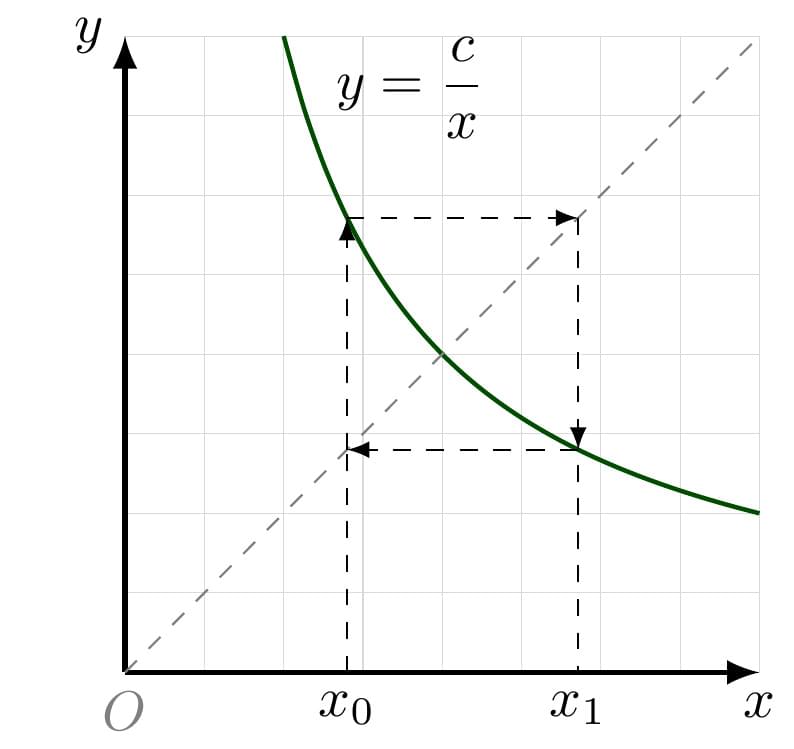
![y=c/x](https://writelatex.s3.amazonaws.com/published_ver/8158.jpeg?X-Amz-Expires=14400&X-Amz-Date=20250119T062025Z&X-Amz-Algorithm=AWS4-HMAC-SHA256&X-Amz-Credential=AKIAWJBOALPNFPV7PVH5/20250119/us-east-1/s3/aws4_request&X-Amz-SignedHeaders=host&X-Amz-Signature=13b774d1f441bcc5024c93fb7fad66e1380afecddce94f70e6ccbd93bac60e3b)
\(y=\frac{c}{x}\)
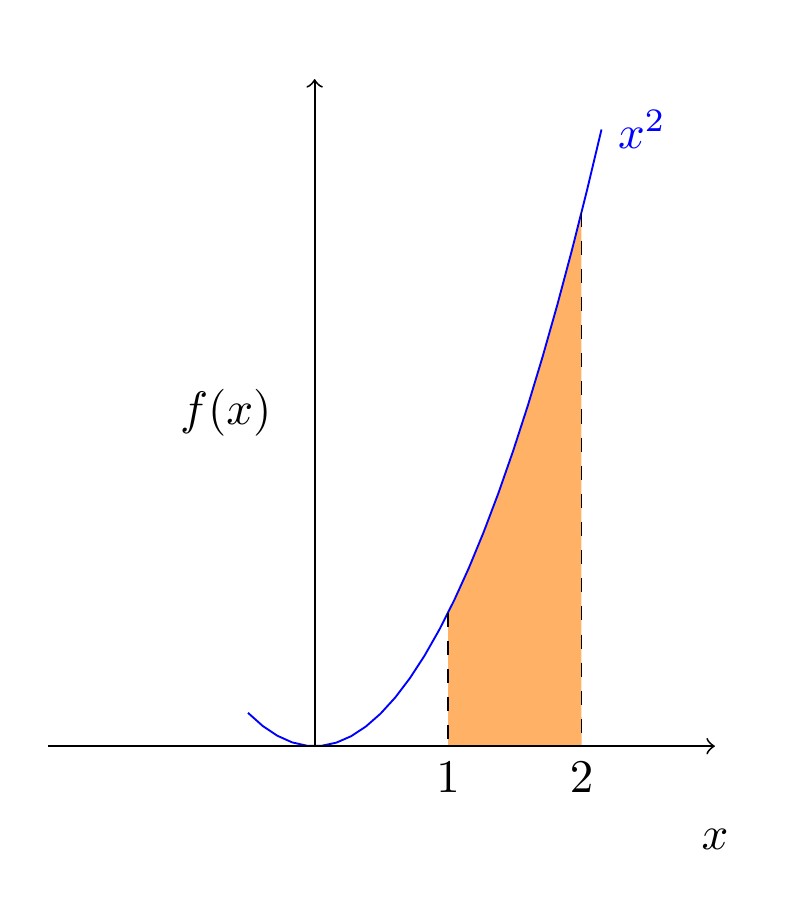
![Região sob um gráfico](https://writelatex.s3.amazonaws.com/published_ver/6594.jpeg?X-Amz-Expires=14400&X-Amz-Date=20250119T062025Z&X-Amz-Algorithm=AWS4-HMAC-SHA256&X-Amz-Credential=AKIAWJBOALPNFPV7PVH5/20250119/us-east-1/s3/aws4_request&X-Amz-SignedHeaders=host&X-Amz-Signature=5e3657e19cf8b3b6965b97406afb8198b166fbb446177965b3e177546d5076ad)
Neste projeto é apresentado o código para criar uma região colorida sob um gráfico. Para detalhes sobre o projeto: marcos.ufal.mat@gmail.com
![Typesetting Z specifications with zed-csp](https://writelatex.s3.amazonaws.com/published_ver/5457.jpeg?X-Amz-Expires=14400&X-Amz-Date=20250119T062025Z&X-Amz-Algorithm=AWS4-HMAC-SHA256&X-Amz-Credential=AKIAWJBOALPNFPV7PVH5/20250119/us-east-1/s3/aws4_request&X-Amz-SignedHeaders=host&X-Amz-Signature=486ab80ac66b12aa0a46b8c7195aa172783f35c671ea7803c83c1edb51ea0883)
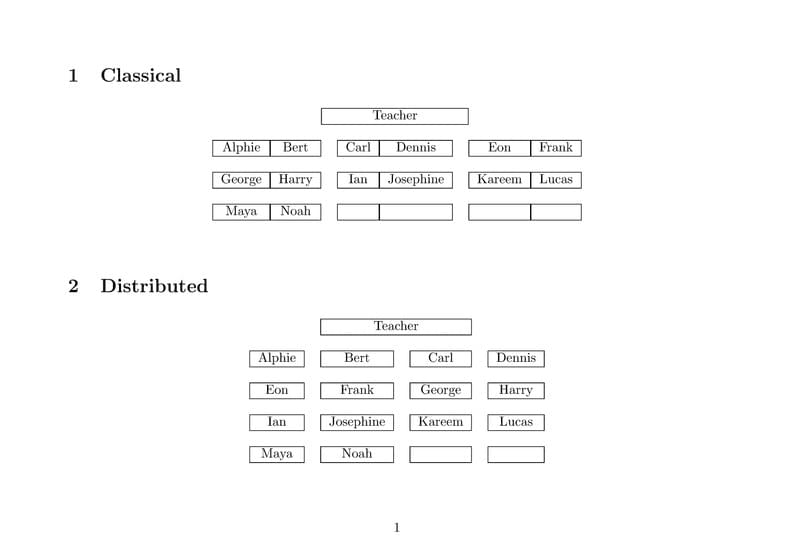
Examples from the zed-csp documentation.
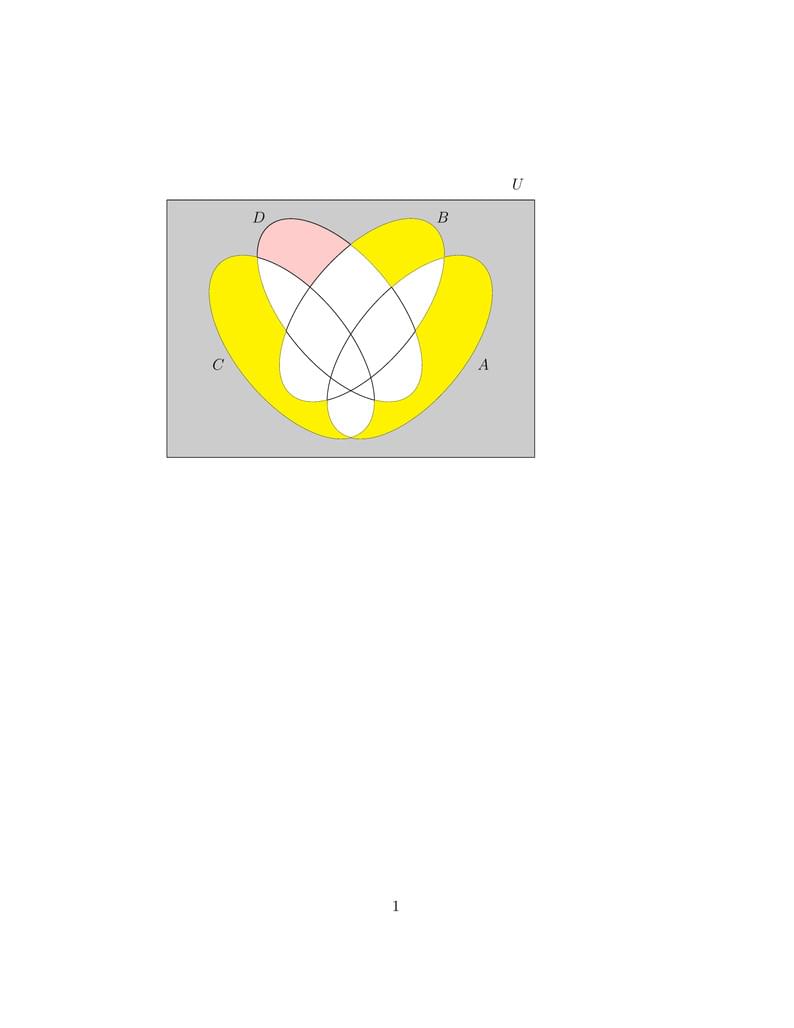
![Venn Diagrams](https://writelatex.s3.amazonaws.com/published_ver/4778.jpeg?X-Amz-Expires=14400&X-Amz-Date=20250119T062025Z&X-Amz-Algorithm=AWS4-HMAC-SHA256&X-Amz-Credential=AKIAWJBOALPNFPV7PVH5/20250119/us-east-1/s3/aws4_request&X-Amz-SignedHeaders=host&X-Amz-Signature=bdba7153563bcc909de0455f911701a4661d2a1578fb1b6044b375921ed37e20)
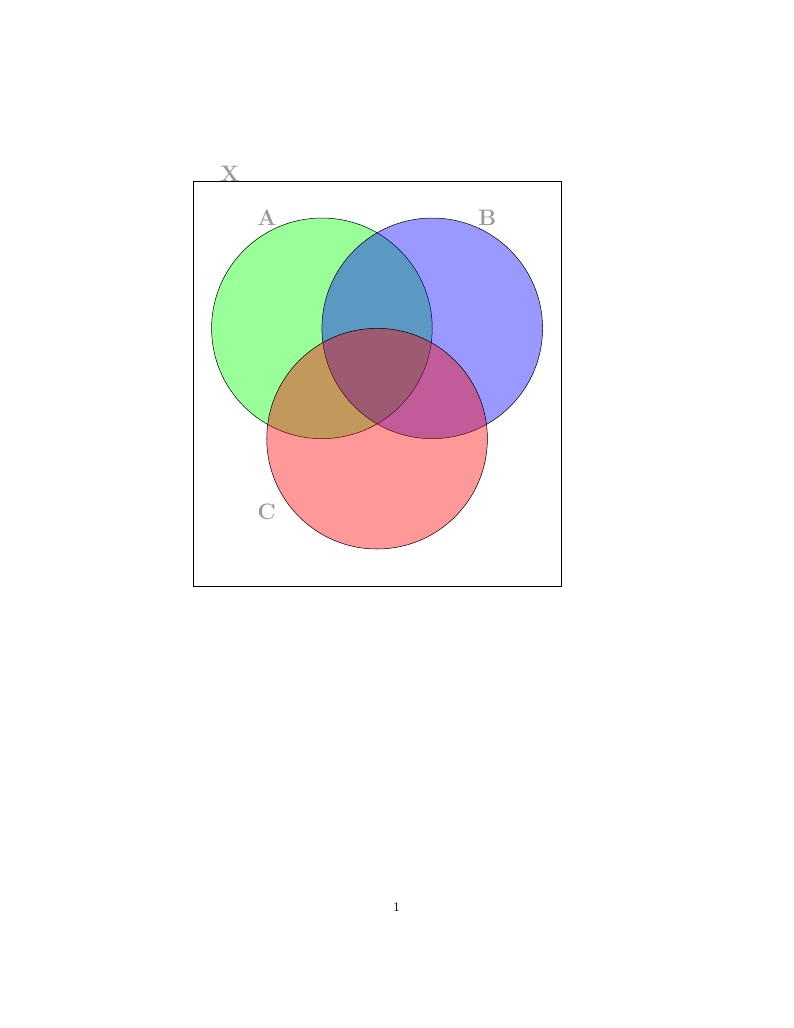
This is a short template on the creation of Venn Diagrams.
![Example: gnuplot + tikz](https://writelatex.s3.amazonaws.com/published_ver/4044.jpeg?X-Amz-Expires=14400&X-Amz-Date=20250119T062025Z&X-Amz-Algorithm=AWS4-HMAC-SHA256&X-Amz-Credential=AKIAWJBOALPNFPV7PVH5/20250119/us-east-1/s3/aws4_request&X-Amz-SignedHeaders=host&X-Amz-Signature=2ef16caceb54b6c13d81f82b279f88bd80a92788687441aaf67c4cf2882e4a50)
This is an example for re-creating gnuplot charts with tikz on LaTeX, made possible by adding gnuplot-lua-tikz.sty and gnuplot-lua-tikz-common.tex to your project. (These files can be generated by invoking lua gnuplot-tikz.lua style where gnuplot-tikz.lua can be found in $GNUPLOT/lua/gnuplot-tikz.lua. (This will work with all engines, not just LuaLaTeX!)
![Inference Rules and T-diagrams with the semantic Package](https://writelatex.s3.amazonaws.com/published_ver/2572.jpeg?X-Amz-Expires=14400&X-Amz-Date=20250119T062025Z&X-Amz-Algorithm=AWS4-HMAC-SHA256&X-Amz-Credential=AKIAWJBOALPNFPV7PVH5/20250119/us-east-1/s3/aws4_request&X-Amz-SignedHeaders=host&X-Amz-Signature=ac316e39e29d036ed97a3360a7279b5b8af15e8db1c56250a07a45f677182bb7)
Some examples of typesetting inference rules and T-diagrams using the semantic package.
![Flow Diagram for a numerical algorithm](https://writelatex.s3.amazonaws.com/published_ver/2170.jpeg?X-Amz-Expires=14400&X-Amz-Date=20250119T062025Z&X-Amz-Algorithm=AWS4-HMAC-SHA256&X-Amz-Credential=AKIAWJBOALPNFPV7PVH5/20250119/us-east-1/s3/aws4_request&X-Amz-SignedHeaders=host&X-Amz-Signature=9b4362d69a94520035f427d2755b1591c444fcc9a93099eda28d00ec36230579)
Introducing Canonical Polynomial approximation methods for solving singularly perturbed bvps.
![qobitree -- pakietomat.wordpress.com](https://writelatex.s3.amazonaws.com/published_ver/943.jpeg?X-Amz-Expires=14400&X-Amz-Date=20250119T062025Z&X-Amz-Algorithm=AWS4-HMAC-SHA256&X-Amz-Credential=AKIAWJBOALPNFPV7PVH5/20250119/us-east-1/s3/aws4_request&X-Amz-SignedHeaders=host&X-Amz-Signature=51468cc03738aed1248e62f7b5f37779081c5afe1555439f1b13a009b2d77556)
Pakiet umożliwia robienie prostych grafów. Jest prosty i efektowny w działaniu. Kolejne polecenia \leaf umieszczają na stosie swoje parametry, a polecenia \branch zdejmują ze stosu wskazaną pierwszym argumentem liczbę obiektów i łączą je ukośnymi liniami; graf jest budowany w odwrotnej kolejności.
![Drawing Pie Charts with pgf-pie](https://writelatex.s3.amazonaws.com/published_ver/881.jpeg?X-Amz-Expires=14400&X-Amz-Date=20250119T062025Z&X-Amz-Algorithm=AWS4-HMAC-SHA256&X-Amz-Credential=AKIAWJBOALPNFPV7PVH5/20250119/us-east-1/s3/aws4_request&X-Amz-SignedHeaders=host&X-Amz-Signature=b61232b1d1c4c4a88f23ff07f1c17746ea199bc6b21cfe5de754e0a583b03aba)
pgf-pie is a LaTeX package for drawing pie charts (and some interesting variants on pie charts) with the PGF/TikZ graphics package. The examples in this document are from the pgf-pie manual, version 0.2. The source code for pgf-pie is available at http://code.google.com/p/pgf-pie/.
\begin
Opdag hvorfor 18 millioner mennesker verden rundt stoler på Overleaf med deres arbejde.