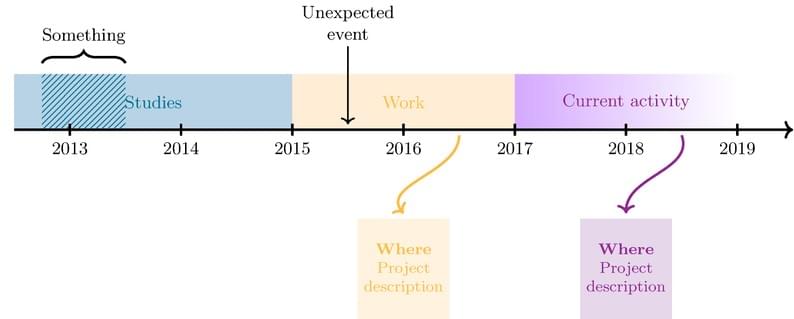
Timeline
Forfatter:
Sofia JIJON
Sidst opdateret:
4 år siden
Licens:
LaTeX Project Public License 1.3c
Resumé:
A simple yet colourful timeline
\begin
Discover why over 25 million people worldwide trust Overleaf with their work.
\begin
Discover why over 25 million people worldwide trust Overleaf with their work.
\documentclass{standalone}

\usepackage[usenames,dvipsnames]{xcolor}
\usepackage{tikz} \usetikzlibrary{calc, arrows.meta, intersections, patterns, positioning, shapes.misc, fadings, through,decorations.pathreplacing}

\definecolor{ColorOne}{named}{MidnightBlue}
\definecolor{ColorTwo}{named}{Dandelion}
\definecolor{ColorThree}{named}{Plum}

\begin{document}

\tikzstyle{descript} = [text = black,align=center, minimum height=1.8cm, align=center, outer sep=0pt,font = \footnotesize]
\tikzstyle{activity} =[align=center,outer sep=1pt]

\begin{tikzpicture}[very thick, black]
\small

%% Coordinates
\coordinate (O) at (-1,0); % Origin
\coordinate (P1) at (4,0);
\coordinate (P2) at (8,0);
\coordinate (P3) at (12,0);
\coordinate (F) at (13,0); %End
\coordinate (E1) at (5,0); %Event
\coordinate (E2) at (0.5,0); %Event

%% Filled regions
\fill[color=ColorOne!20] rectangle (O) -- (P1) -- ($(P1)+(0,1)$) -- ($(O)+(0,1)$); % Studies
\path [pattern color=ColorOne, pattern=north east lines, line width = 1pt, very thick] rectangle ($(O)+(0.5,0)$) -- ($(O)+(2,0)$) -- ($(O)+(2,1)$) -- ($(O)+(0.5,1)$); % Something else
\fill[color=ColorTwo!20] rectangle (P1) -- (P2) -- ($(P2)+(0,1)$) -- ($(P1)+(0,1)$); % Work
\shade[left color=ColorThree, right color=white] rectangle (P2) -- (P3) -- ($(P3)+(0,1)$) -- ($(P2)+(0,1)$); % Current work

%% Text inside filled regions
\draw ($(P1)+(-2.5,0.5)$) node[activity,ColorOne] {Studies};
\draw ($(P2)+(-2,0.5)$) node[activity,ColorTwo] {Work};
\draw ($(P3)+(-2,0.5)$)  node[activity, ColorThree] {Current activity};

%% Description
\node[descript,fill=ColorTwo!15,text=ColorTwo](D2) at ($(P2)+(-2,-2.5)$) {%
	\textbf{Where}\\
	Project\\
	description};

\node[descript,fill=ColorThree!15,text=ColorThree](D3) at ($(P3)+(-2,-2.5)$) {%
	\textbf{Where}\\
	Project\\
	description};

%% Events
\draw[<-,thick,color=black] ($(E1)+(0,0.1)$) -- ($(E1)+(0,1.5)$) node [above=0pt,align=center,black] {Unexpected\\event};
\draw [decorate,decoration={brace,amplitude=6pt}]($(E2)+(-1,1.2)$) -- ($(E2)+(0.5,1.2)$) node [black,midway,above=6pt] {Something};

%% Arrows
\path[->,color=ColorTwo] ($(P2)+(-1,-0.1)$) edge [out=-90, in=130]  ($(D2)+(0,1)$);
\path[->,color=ColorThree]($(P3)+(-1,-0.1)$)  edge [out=-70, in=90]  ($(D3)+(0,1)$);

%% Arrow
\draw[->] (O) -- (F);
%% Ticks
\foreach \x in {0,2,...,12}
\draw(\x cm,3pt) -- (\x cm,-3pt);
%% Labels
\foreach \i \j in {0/2013,2/2014,4/2015,6/2016,8/2017,10/2018,12/2019}{
	\draw (\i,0) node[below=3pt] {\j} ;
}

\end{tikzpicture}

\end{document}