Create beautiful Life Science infographics with MindTheGraph
June 11, 2016How often do we find the illustrations we need for our presentations or posters? It gets even worse when we need an illustration for a paper, right?
Many images online are not professional enough, or don’t show the exact aspects we need. They are not scientifically "sound", so to speak. In the meanwhile, influent scientific journals are changing their publishing process. The changes aim to include graphical abstracts and give a lot more value to images. Have you heard about the article of the future project by Elsevier?
Well-made figures are key to be found in the internet era and a very important asset in scientific communication. However, most of authors are not really comfortable with design tools like Illustrator and Photoshop… that's why we need Google Images so badly and spend so much time on it, even that we often don't find exactly what we need.
The bad news is that this might become an additional challenge when trying to convince editor and reviewers to publish your papers.
How to solve this problem? How could you better commnuicate your research without access to good scientific illustrations?
Thinking about that, we created Mind the Graph! Mind the Graph aimes to help scientists in communicating their findings in a simple, beautiful and professional way. We wanna help making your science less complicated and bring it closer to your audience!
Here is how Mind the Graph works!
Here we go. First things first: enter mindthegraph.com.

Step 1. Go to our website and click on start for free. Next, you will be able to sign up!

Step 2. Click on ‘Create new file’. You may choose between a template or a blank workspace. If you choose to start blank, three size options will be available.

Step 3. On your left, you will find a tool bar. Click on ‘Icons’ and search for the illustrations you want by using tags at the search box. Our platform will help you with the search by indicating related tags under the search box. If you want to start over a new search, clean up your previous tags by clickng on the ‘X’ button.

Step 4. You can also find text, shapes, graphs and background options in the tool bar on your left. In addition, you can upload images to your workspace by clicking on ‘Uploads’.

Step 5. When you are finished, click on ‘Download’ and choose the way to save your work!

Mind the Graph has an auto-saving system to help you not losing your work. However, you may save your project as you please by clicking on the ‘Save’ button
Important! The free version has some limitations. However, at a low price you can switch to the premium version. Check all the benefits here.
Mind the Graph - Overleaf integration
Every artwork you create at Mind the Graph can be imported to Overleaf. Follow these steps:
Step 1. Click on download and choose the format you want your work.

Step 2. You will see a box with sharing options and a link. Open that link in a new tab.
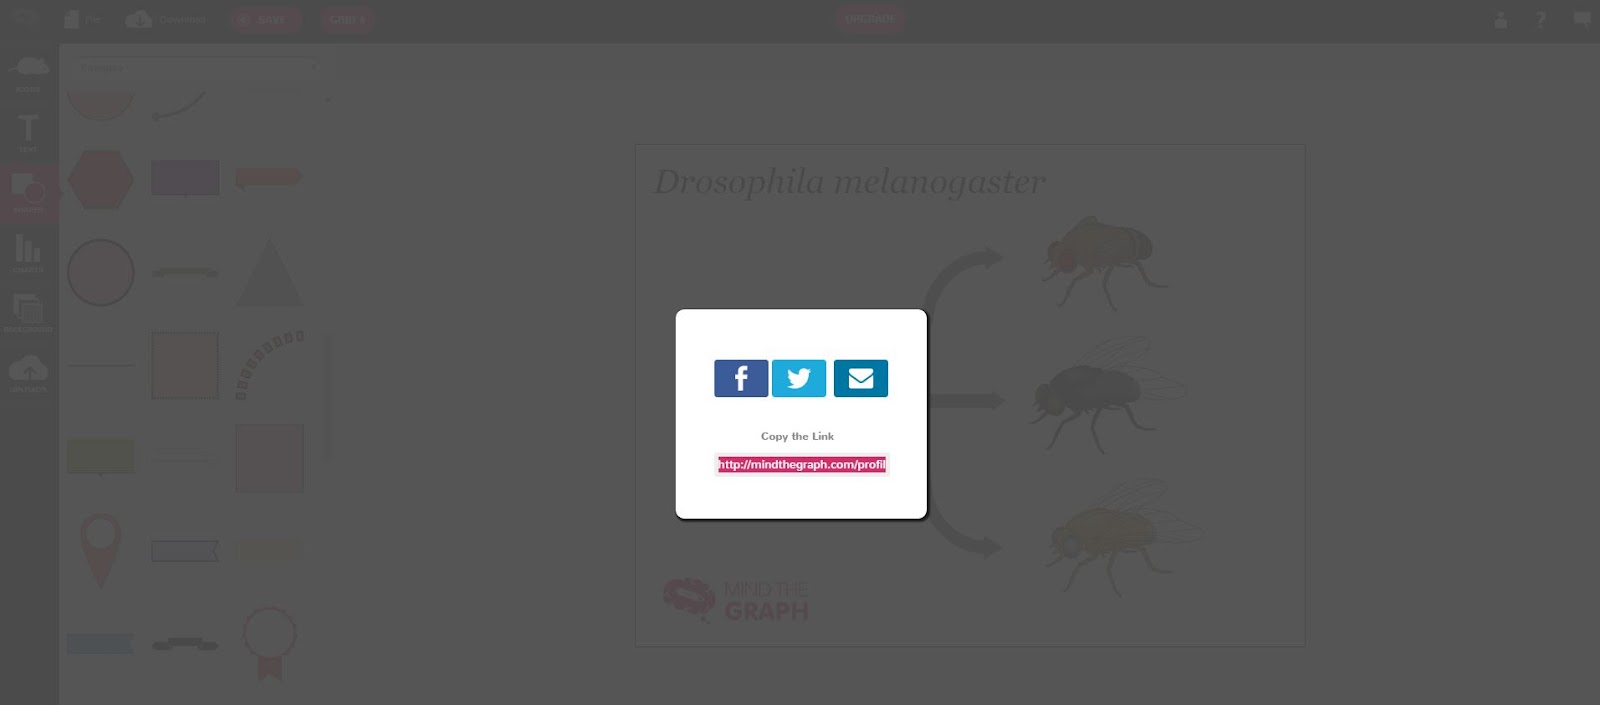
Step 3. Click with the right button over the image and select the option ‘Copy Image Address’

Step 4. Go to your Overleaf projects dashboard and choose a new project.

Step 5. On your left side, click on ‘Add files’ and select the option ‘URL’.

Step 6. Paste the URL from Mind the Graph and you are ready to use your creation in Overleaf!

All set? Now get started on mindthegraph.com!