Laboratorio 6: Matlab 01
Forfatter:
Renata Fuentealba
Sidst opdateret:
8 år siden
Licens:
Creative Commons CC BY 4.0
Resumé:
Trabajo Herramientas.

\begin
Discover why over 25 million people worldwide trust Overleaf with their work.
Trabajo Herramientas.

\begin
Discover why over 25 million people worldwide trust Overleaf with their work.
\documentclass[a4paper]{article}

%% Language and font encodings
\usepackage[english]{babel}
\usepackage[utf8x]{inputenc}
\usepackage[T1]{fontenc}

%% Sets page size and margins
\usepackage[a4paper,top=3cm,bottom=2cm,left=3cm,right=3cm,marginparwidth=1.75cm]{geometry}

%% Useful packages
\usepackage{amsmath}
\usepackage{graphicx}
\usepackage[colorinlistoftodos]{todonotes}
\usepackage[colorlinks=true, allcolors=blue]{hyperref}

\title{Laboratorio 6: Matlab 01}
\author{Renata Fuentealba Marambio.}

\begin{document}
\maketitle


\section{Vectores y Matrices.}

\subsection{Operaciones con vectores y gráficos.}

\begin{itemize}
\item x = [10:-2:1]
\end{itemize}
x =

   10    8    6    4    2

\begin{itemize}
\item  x*2
\end{itemize}
ans =

   20   16   12    8    4

\begin{itemize}
\item x*x
\end{itemize}
error: operator *: nonconformant arguments (op1 is 1x5, op2 is 1x5)

 \begin{itemize}
\item x.*x
\end{itemize}
ans =

   100    64    36    16     4

\begin{itemize}
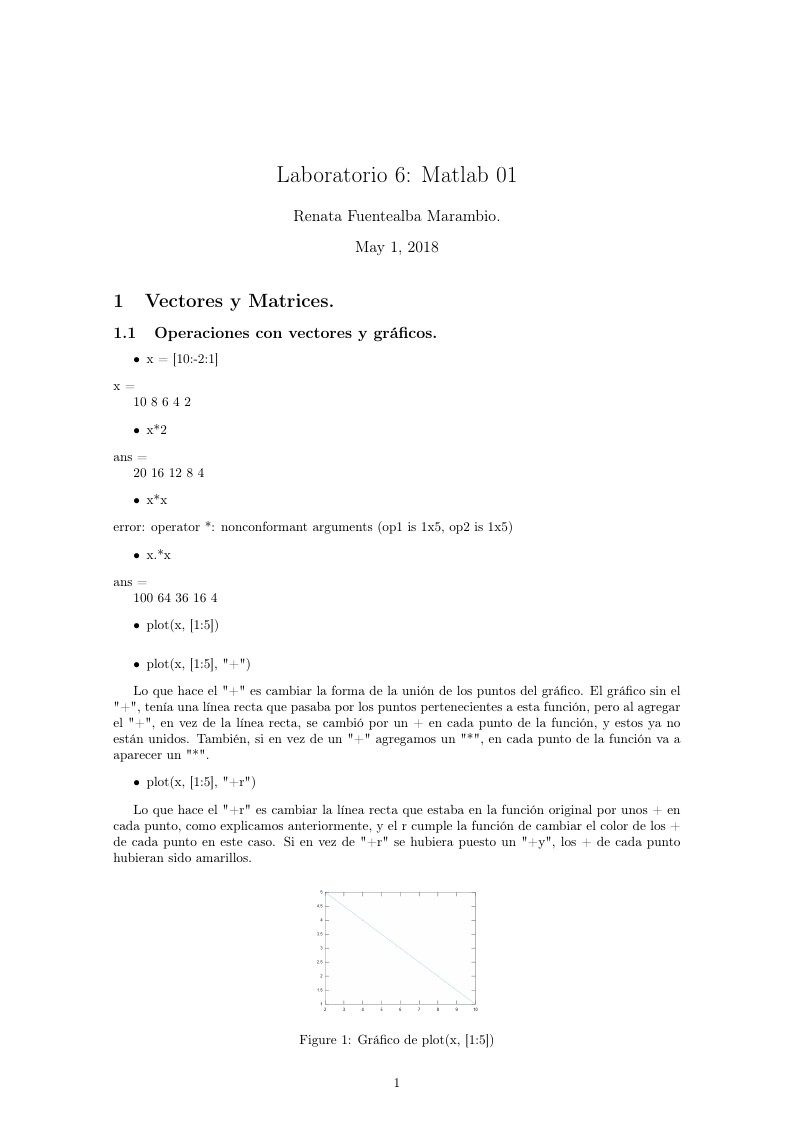
\item plot(x, [1:5])
\end{itemize}
\begin{figure}
\centering
\includegraphics[width=0.3\textwidth]{Gr_fico_plot1_5.png}
\caption{\label{fig:frog}Gráfico de plot(x, [1:5])}
\end{figure}

\begin{itemize}
\item plot(x, [1:5], "+")
\end{itemize}

\begin{figure}
\centering
\includegraphics[width=0.3\textwidth]{GR_FICO+_.png}
\caption{\label{fig:frog}Gráfico de plot(x, [1:5], "+")}
\end{figure}
Lo que hace el "+" es cambiar la forma de la unión de los puntos del gráfico. El gráfico sin el "+", tenía una línea recta que pasaba por los puntos pertenecientes a esta función, pero al agregar el "+", en vez de la línea recta, se cambió por un + en cada punto de la función, y estos ya no están unidos. También, si en vez de un "+" agregamos un "*", en cada punto de la función va a aparecer un "*".

\begin{itemize}
\item plot(x, [1:5], "+r")
\end{itemize}

\begin{figure}
\centering
\includegraphics[width=0.3\textwidth]{plot3.png}
\caption{\label{fig:frog} Gráfico de plot(x,[1:5], "r")}
\end{figure}
Lo que hace el "+r" es cambiar la línea recta que estaba en la función original por unos + en cada punto, como explicamos anteriormente, y el r cumple la función de cambiar el color de los + de cada punto en este caso. Si en vez de "+r" se hubiera puesto un "+y", los + de cada punto hubieran sido amarillos.

\subsection{Operaciones con matrices.}
\begin{itemize}
\item m1 = 1:4
\end{itemize}
m1 =

   1   2   3   4

\begin{itemize}
\item m2 = m1'
\end{itemize}

m2 =

   1
   2
   3
   4

\begin{itemize}
\item m1*m2
\end{itemize}

ans =  30

\begin{itemize}
\item m2*m1
\end{itemize}

ans =

    1    2    3    4
    2    4    6    8
    3    6    9   12
    4    8   12   16

\begin{itemize}
\item m3 = [1:4; 0 4:2:8; 0 0 9:3:12; 0 0 0 16]
\end{itemize}

m3 =

    1    2    3    4
    0    4    6    8
    0    0    9   12
    0    0    0   16

\begin{itemize}
\item m4 = m3'
\end{itemize}

m4 =

    1    0    0    0
    2    4    0    0
    3    6    9    0
    4    8   12   16

\begin{itemize}
\item m3*m4
\end{itemize}

ans =

    30    58    75    64
    58   116   150   128
    75   150   225   192
    64   128   192   256

\begin{itemize}
\item m4*m3
\end{itemize}

ans =

     1     2     3     4
     2    20    30    40
     3    30   126   168
     4    40   168   480

\end{document}